A marketing stack is a set of tools and system that companies use to execute their marketing.
With the sea of marketing analytics tools in the market, where do we even begin?
While startups often prioritize minimum viable product (MVP), a minimum viable marketing analytics stack is equally important. Minimum viable marketing analytics is a simple tracking framework that provides “just enough” insights on your marketing and website for fast iteration.
Without it, startups would risk:
- Wasted resources — leaky funnels; more headcount and time needed for manual, repetitive work just to get marketing analytics done
- Slower growth — wasted marketing opportunities from lack of or no visibility; slower iteration as there are too many channels and marketing analytics tools to juggle, thus missing your marketing KPIs
In this post, we'll outline the essential components for tracking KPIs related to your acquisition activities and marketing efforts. For each step, we'll also provide recommendations for both free and paid marketing analytics tools.
Why bother?
If you have started acquiring customers from multiple sources, it is essential to measure and track various marketing KPIs and break them down by channel. This allows you to understand:
- Which channel drives the best quality traffic?
- Which is the most cost-effective marketing channel?
- Which is the most effective marketing channel and should be scaled?
Building a Minimum Viable Marketing Analytics stack
How do you build a marketing analytics stack?
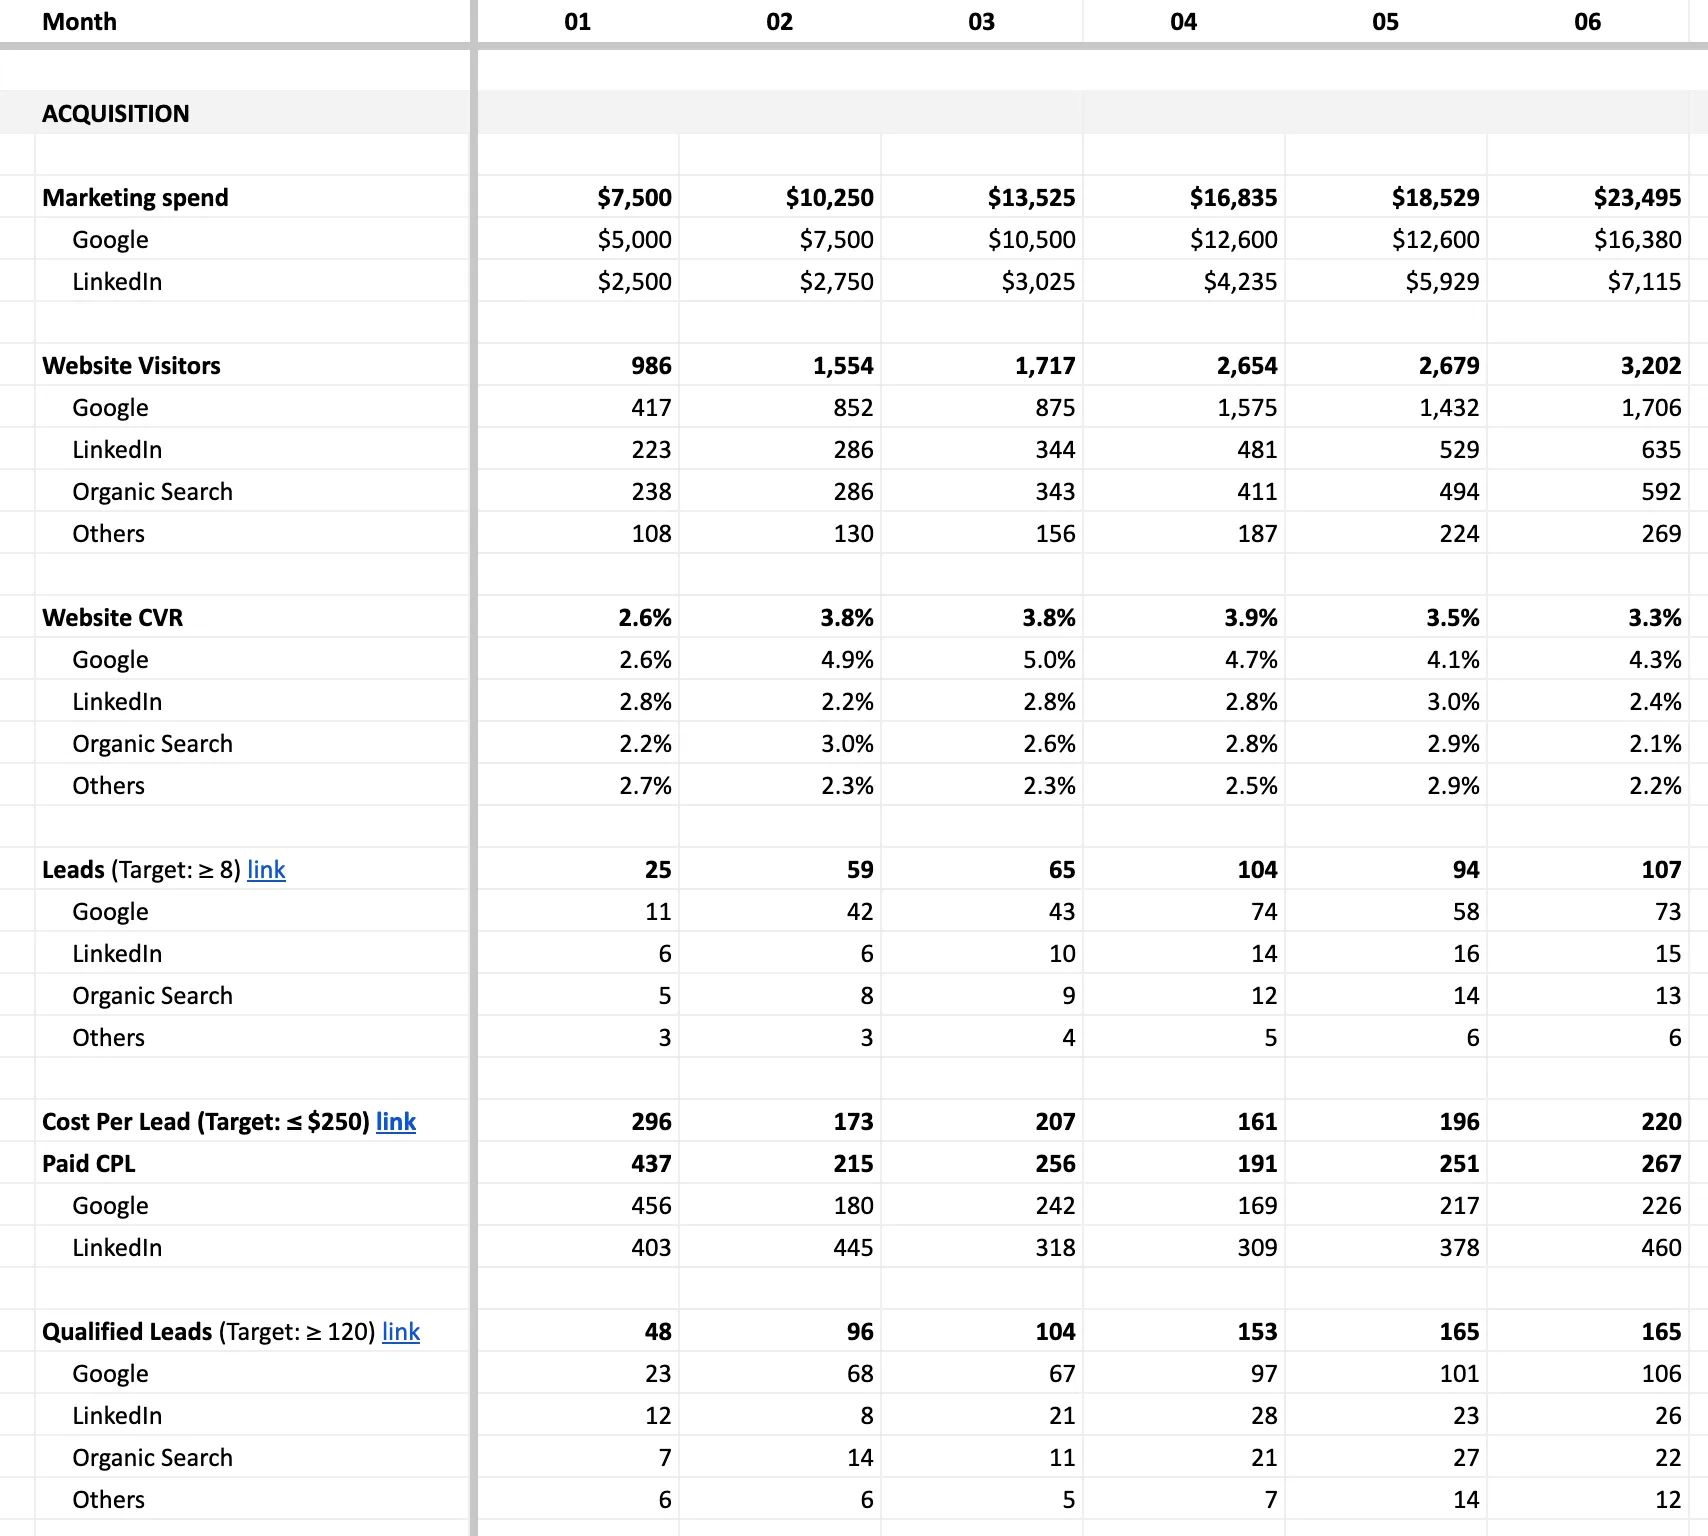
Your minimum viable marketing analytics stack can be as simple as having a spreadsheet where you manually get the data from their respective sources. Start your marketing analytics effort by updating your KPIs regularly (weekly/monthly). The key here, is to have reliable data sources from which you can obtain each metric value and have a simple marketing analytics dashboard.
At a later stage, you may want to invest time and money to build a data analytics pipeline that provides access to raw data and allows you to create custom dashboards.
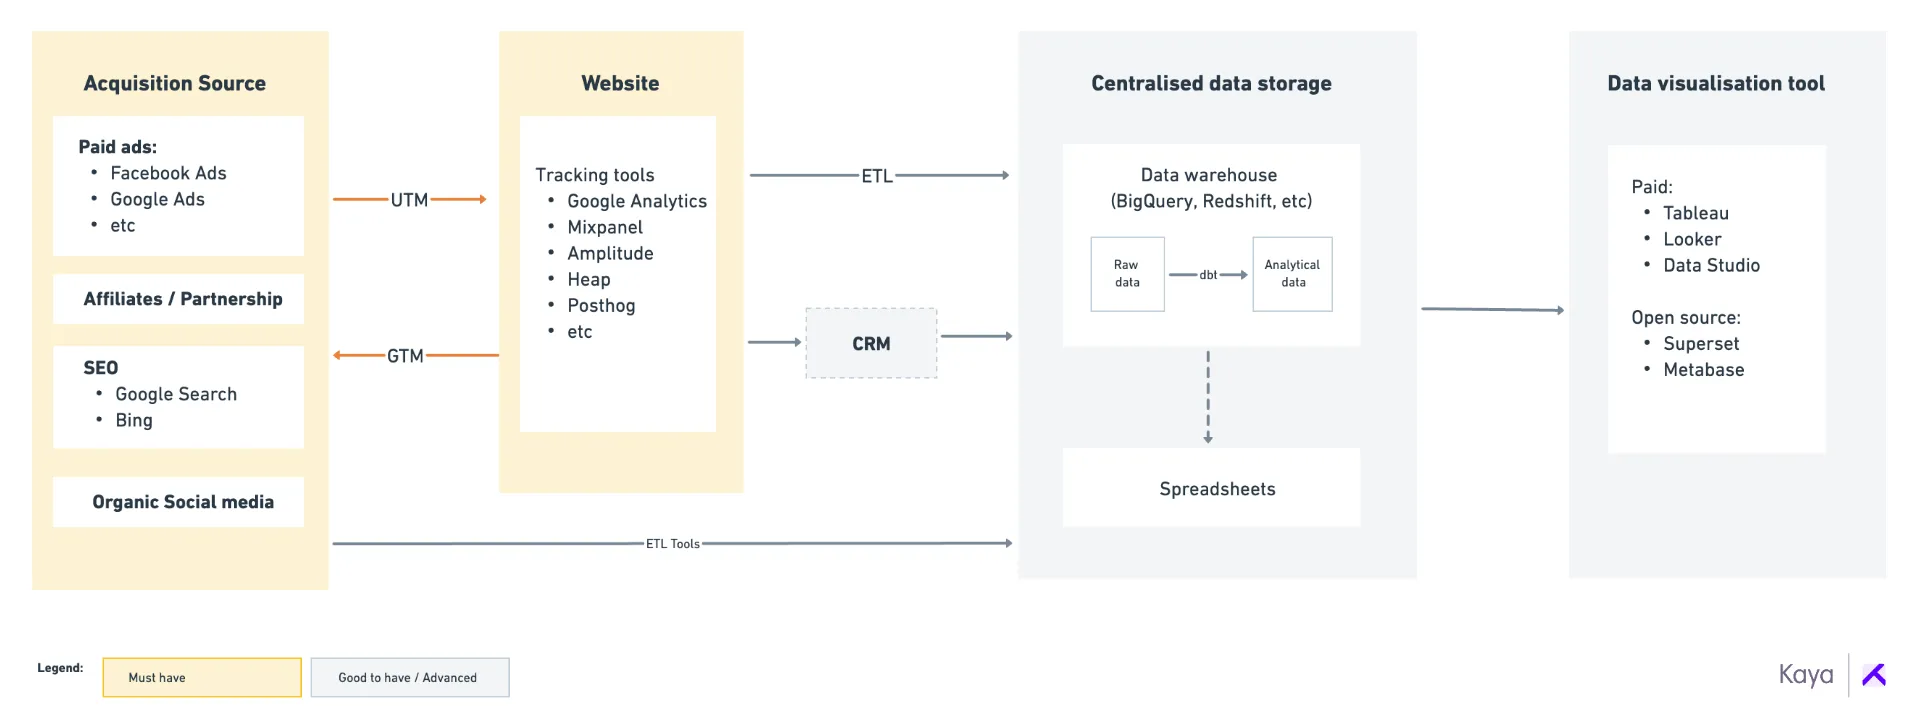
The following diagram shows the high-level architecture of a marketing analytics stack:

High-level architecture of a marketing analytics stack, comprising of: Data acquisition source; UTM tagging; Website tracking tools; Centralized data storage; Data visualization tool
Phase 1: Must-haves to build your Marketing Analytics stack
Between acquisition source & your website
1. Acquisition source
An acquisition source is a platform or method you use to get new users or customers. Customer acquisition channels can be broken down into paid and organic. Paid channels include Google Ads, Facebook Ads, affiliate marketing, etc. Organic channels include SEO, organic social media, etc.
Each platform provides reporting functionality that allows you to customize and measure specific stats.
A special mention for a lesser-known but powerful tool is Google Search Console. Make sure to set it up so you can track how your site is performing on Google's search results pages.
2. UTM tagging
How do you know where does the website traffic come from?
Given that the website receives visitors from multiple sources, how do you track traffic sources whether from a particular email, social media post, referral website, etc.?
The answer is UTM tagging.
What is UTM tagging?
UTM codes are the parameters you can add to the end of a URL that provide more context on where the traffic is coming from. You might have come across it in your day-to-day browsing. UTM best practices include maintaining consistent tagging and using concise, descriptive, lowercase tags.
We also recommend having a UTM Google Sheet to keep track of all your links. Here’s a free UTM tagging sheet we use internally (think of it as a UTM tagging builder!).
3. Website tracking tools
Website tracking tools provide analytics on how visitors interact with your website and their demographics.
How to track visitors on a website for free?
Google Analytics 4 (GA4). This is the most popular tool. You should have it set up from day one.
Which tool is best for website tracking?
GA4 is a good option to start. However if you’re looking for more sophisticated options with more user-friendly UI and customizations, consider these Posthog, Mixpanel, and Amplitude, which have paid/freemium options.
Even if you use these sophisticated tools, you should still keep GA4 in place. There are a few things that can be done more easily with GA4 thanks to its tight integration with other tools within Google’s ecosystem.
For each tool, you need to ensure that your key conversion events are tracked. These are the desired actions you want visitors to take, such as submitting lead forms or completing a purchase.
With these in place, you can now calculate your website conversion rate and look for ways to increase your website conversion rate.
4. Google Tag Manager (GTM) (optional if you’re not running paid ads):
If you’re running paid ads, it’s important to send data back to the ads platform so they can optimize their algorithm and bring you visitors that convert. Each ads platform has its own tracking script, and managing multiple tracking scripts can become challenging. This is where a tag (code snippet) management system comes in handy. Install them once, and you can send data to multiple platforms without making any front-end code changes.
- Free: GTM (Google Tag Manager). You can also use GTM to send events to GA4.
- Paid/Freemium: Segment and Rudderstack. These tools make it easier to send server-side events (i.e., actions that are not taken on the marketing site).
Once you have all the above set up, you’ll be able to manually extract metrics from the respective platforms into a spreadsheet. Most channels provide reporting features to export data into different file formats on a schedule. Alternatively, you can use automation tools like Zapier to automate your marketing process, including this marketing report.

Automate your marketing report generation with tools like Zapier to receive updates on a weekly or monthly schedule.
Here are the marketing metrics you should measure per channel:
- Number of visitors
- Number of funnel conversion events, i.e., key milestones carried out by visitors to achieve your business goal, and their conversion rate from one step to another. For example:
- B2B: Lead form submission, Sales qualified leads, Won deals
- E-commerce: Add-to-cart, Payment
- Cost spent per channel
- Revenue per channel
- Cost per lead, Customer Acquisition Cost (CAC) per channel
And don’t forget their respective growth rates and unit costs as you prepare your marketing analytics dashboard.
Phase 2: Automate and customize your Marketing Analytics
Eventually, you will outgrow your spreadsheet as you’ll spend more time doing manual data pulling, reconciliation, and repetitive analysis. This is when you’d be upgrading marketing analytics stack by automating your marketing processes.
Getting data from acquisition channels & website tracking tools to centralized storage
You can build a viable marketing analytics platform without having a technical team, simply with tools such as Google Data Studio. However, we’ll focus on how to build this marketing analytics stack assuming you have a technical team.
First, determine what technology you want to use as your central storage, also known as a data warehouse: Postgres, BigQuery, Redshift, etc.
- Pros: More flexible; allows for all sorts of analysis
- Cons: More expensive than maintaining a spreadsheet, both in terms of cost and time required to set up and maintain
You also need to ensure you have dedicated resources to maintain the Extract, Transform, Load (ETL) process. To save engineering time, we recommend using no-code ETL tools. Some popular ones include: Funnel IO, Supermetrics, Fivetran and Airbyte.
These tools allow you to pull raw data from the respective platforms into your data warehouse with a few clicks. Next, you’ll need to transform the data into an analysis-ready format. We recommend using dbt to take care of data transformation.
Finally, you can start visualizing your marketing data with dashboarding tools:
- If you’re familiar with SQL: Metabase, Superset
- If you’re not: Looker, Data Studio
Final thoughts
By now you’d have built a solid marketing analytics stack and have a huge boring part of your marketing processes automated. With these automated marketing report in hand, you can now make faster, better, smarter marketing decisions and see better marketing ROI. We hope this article shed some light on how to set up a minimum viable marketing analytics stack.

