


Ever wonder why most startups, when they are just getting started with paid advertising, choose to start with Google Ads?
Because this is the only platform that shares the most transparent, data-driven view of who they're competing against and how to outmaneuver them in real-time
How?
Through this one tool native to Google Ads: Auction Insights.
But unfortunately, most founders overlook this lever.
Think of it as a backstage pass into who you’re really competing against in the ad auctions. Not just who you think your competitors are. But the brands Google is actually putting you up against. More importantly, how you are stacking up.
This isn’t some extra analytics fluff. Auction Insights can show you why your Cost per Clicks (CPC) are creeping up, who’s stealing your top-of-page placements, when a new competitor starts bidding on your brand and how to spot budget-wasting battles you shouldn’t even be in.
In this guide, we’ll walk you through exactly how to use Google Ads Auction Insights to optimize your Google Ads campaigns’ performance, even if you're not a PPC expert. Whether you’re running ads yourself or reviewing performance with a freelancer or agency, this is one tool you’ll want to start using today.
We will cover:
- What are Google Ads Auction Insights?
- How to find it?
- What the metrics mean?
- How to use Auction Insights for competitor analysis and optimization?
- Pro tips from Team Kaya.
Let’s jump in.
What are Google Ads Auction Insights?
Every time someone searches on Google, there’s an instant auction behind the scenes deciding which ads get shown and in what order. If you’re running search ads, you’re in those auctions constantly. But you’re not flying solo. Google is deciding where you show up compared to other advertisers going after similar keywords.
Auction Insights is the report that tells you how you’re doing in those silent battles.
It answers questions like:
- Are you being outranked by a competitor?
- Are you showing up as often as you could?
- Are others bidding more aggressively on the same terms?
Instead of guessing who’s beating you and why, you get hard data directly from Google.
What the Auction Insights report shows
You’ll see a list of other advertisers who were in the same auctions as you, and six key metrics that tell you how your performance compares (we’ll break each one down soon).
This means Auction Insights isn’t just a report. It’s like your competitive radar showing who’s in the game, how strong they are, and where you stand.
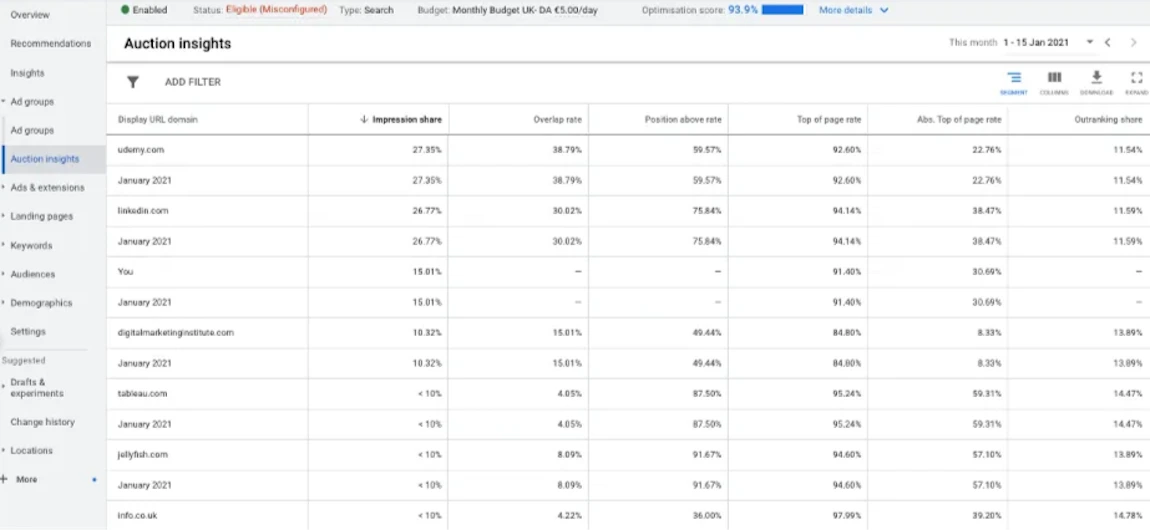
This is how an Auction Insights report looks. Source: Glowmetrics
Where to find Auction Insights in Google Ads
1. Go to your Google Ads account: Log into ads.google.com and choose the account you want to analyze.
2. Click into the Campaigns, Ad groups, or Keywords tab: Choose the level you want to analyze. You can access Auction Insights from all three.
3. Select the checkbox beside the item(s) you want insights for: You can select one or multiple campaigns, ad groups, or keywords.
4. Click the “More” (three dots) button: A small menu will pop up. Click Auction Insights from there.
That’s it. Google will generate a report showing how your selected campaign, ad group, or keyword performs in comparison to others in the same auctions.
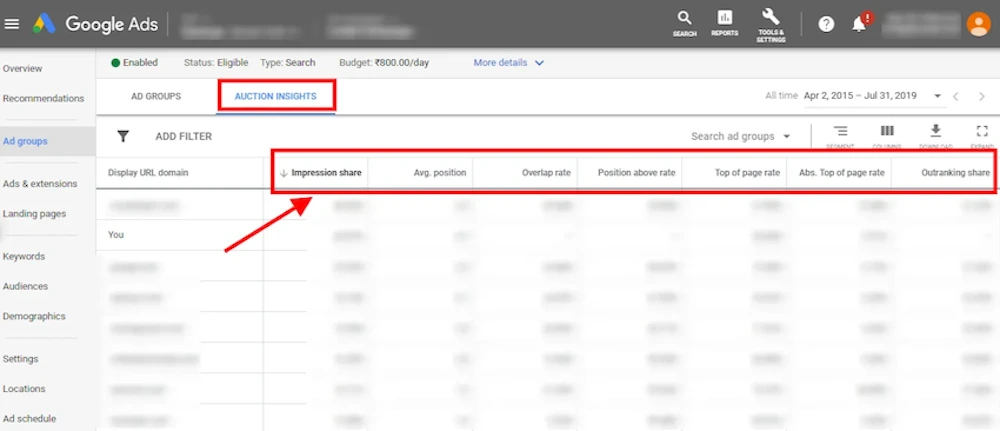
You can see keyword-level performance on Auction Insights. Source: Karooya
What each Auction Insights metric means (with examples + what to do)
Once you open the Auction Insights report, you’ll see a table comparing your performance against other advertisers bidding in the same auctions. Alongside each competitor, you’ll see six key metrics.
These metrics tell a story about your position, visibility, and competitiveness.
Let’s break them down one by one.
1. Impression Share
Out of all the times your ad could have shown, this is how often it actually did. A 45% impression share means you only showed up in 45 out of every 100 eligible searches.
Example:
If your impression share is 45%, that means you showed up in 45 out of every 100 eligible auctions.
How to use it:
If this number is low, you’re either:
- Limited by budget (Google’s holding back your ad)
- Or getting outcompeted due to low bids or poor Quality Score
Start by checking if your campaign is hitting its daily budget. If not, focus on improving ad relevance, landing pages, and click-through rate. Remember, better Quality Score = more impressions for the same spend.
2. Overlap Rate
This shows how often another advertiser’s ad showed up in the same auctions as yours. A 60% overlap with Competitor X means they’re showing up with you in 60 out of 100 auctions.
Example:
An overlap rate of 60% with Brand X means their ads showed up 60% of the time when yours did.
How to use it:
A high overlap rate signals a direct competitor. Look them up. What kind of headlines and offers are they running? If their messaging is sharper, it’s time to refresh your ad copy or test more aggressive positioning.
3. Position Above Rate
When both you and a competitor show up in the same auction, this shows how often their ad ranked higher than yours. A 70% score means they’re out-positioning you 7 times out of 10.
Example:
If Competitor A has a position above rate of 75%, they’re beating you in 3 out of 4 auctions.
How to use it:
If someone is consistently ranking above you, they likely have better ad strength or higher bids. Improve your ad copy and extension setup first (since that’s free), then consider testing higher max CPCs for key terms.
4. Top of Page Rate
This tells you how often your ad showed above the organic search results and positions 1 through 4. If this is low, your ad is likely stuck at the bottom of the page.
Example:
A top of page rate of 40% means your ad showed above organic listings in 40% of eligible auctions.
How to use it:
Top-of-page placements drive more clicks. To improve this, make sure your ad is relevant to the search query, your landing page loads quickly, and you’re not spreading budget too thin across too many keywords.
5. Absolute Top of Page Rate
This is the percentage of times you grabbed the very first spot on Google. A 10% rate means you were in the #1 position just 10% of the time.
Example:
If this is 10%, you’re in the #1 spot only 1 out of 10 times.
How to use it:
If this number matters for you (e.g. for branded terms or critical bottom-funnel keywords), consider isolating those keywords in their own campaign, then testing higher bids and better ad structure to secure the top spot.
6. Outranking Share
This shows how often your ad ranked higher than a specific competitor’s ad, or showed when theirs didn’t.
Example:
If you have a 55% outranking share vs Competitor B, you beat them in more than half of the auctions.
How to use it:
This is your scoreboard. A high outranking share means you’re winning; a drop means someone’s creeping up. Use this to track shifts in competition. If someone new appears and starts outranking you, it’s time to investigate and respond.
Metrics available in Auction Insights. Source: Karooya
Quick summary table:
| Metric | What it tells you | Key action |
|---|---|---|
| Impression Share | Are you visible enough? | Raise budget or boost Quality Score |
| Overlap Rate | Who you're up against | Analyze their messaging & strategy |
| Position Above Rate | Are they beating you? | Improve copy or raise bid (strategically) |
| Top of Page Rate | Are you at the top? | Tighten targeting, improve ad structure |
| Absolute Top Rate | Are you #1? | Isolate top terms, boost bids where it matters |
| Outranking Share | Are you winning auctions? | Track against key competitors weekly |
How Auction Insights work across different campaign types
Auction Insights isn’t a one-size-fits-all report. How much you see and what you can do with it depends entirely on the type of campaign you’re running.
That’s because different campaign types offer different levels of control over where and how your ads show up. Some (like Search) are manual and transparent. Others (like Performance Max) are heavily automated and abstracted.
Here’s a breakdown of what to expect with each campaign type and how to make the most of it.
1. Search campaigns: full visibility and full control
This is where Auction Insights is at its most powerful.
Search campaigns are keyword-driven, so you’re choosing the exact terms you want to show up for. That also means you’re entering direct, measurable auctions for each search.
What you get:
- Auction Insights is available at the campaign, ad group, and keyword level
- You’ll see all six core metrics:
- Impression Share
- Overlap Rate
- Position Above Rate
- Top of Page Rate
- Absolute Top of Page Rate
- Outranking Share
As a result of this, you get a clear view of:
- Who your competitors are
- How often you're showing up compared to them
- Whether you’re winning the top spots or falling behind
This kind of detail lets you spot threats early, adjust bids, improve ad copy, and optimize landing pages — all with measurable impact.
Example:
Let’s say you’re bidding on “AI productivity tools” and notice your impression share is dropping while overlap rate with a new competitor is high. That tells you they’re aggressively entering your space. Hence, you might need to refresh your copy, test a higher CPC, or shift budget to your best-converting ad group.
2. Shopping campaigns: moderate insights, but no keyword control
Shopping campaigns are different from Search. Instead of bidding on keywords, you submit a product feed (title, image, price, etc.) and Google matches your listings to user searches based on relevance.
What you get:
- Auction Insights is available at the campaign, ad group, and product group level
- You typically see these metrics:
- Impression Share
- Overlap Rate
- Outranking Share
- Some accounts may also get:
- Top of Page Rate
- Absolute Top of Page Rate (less consistent)
Since you don’t control the keywords, you also don’t get keyword-level auction insights. But you can still see which competitors are showing up next to you for your product categories and how often they’re beating you.
Example:
Suppose you sell running shoes and notice one competitor consistently outranks you on your top-selling product group. Instead of tweaking bids blindly, check:
- Are your product titles optimized?
- Are your prices competitive?
- Do your images stand out?
In Shopping, those factors impact ad rank just as much as bids do, if not more.
3. Performance Max campaigns: Minimal transparency, limited insights
Performance Max (PMax) is the newest (and most automated) campaign type. It runs ads across Search, Display, YouTube, Gmail, Discover — all from a single campaign. As a result, you give Google creative assets, audience signals, and a goal, and it handles the rest.
What you get:
- Very limited Auction Insights
- You might see overall Impression Share, but not:
- Competitor names
- Overlap rate
- Positioning metrics
- Keyword-level data (because there aren’t any)
Performance Max is designed to be a “black box”. It prioritizes automation and machine learning over manual controls. That makes it harder to understand who you’re competing with, or why performance is changing.
It’s great for scale, but not great for diagnostics.
Example:
If your PMax campaign suddenly drops in conversions, Auction Insights won’t help you figure out if a competitor is outranking you. You’ll need to look elsewhere:
- Are your creative assets getting stale?
- Did a seasonal trend change?
- Is your audience signal too broad?
If you want tighter control over top-funnel terms or brand searches, it’s worth running a separate manual Search campaign in parallel where Auction Insights does give you real data.
| Campaign Type | Can you control keywords? | Auction Insight depth | What to watch for |
|---|---|---|---|
| Search | Yes | Full detail: all 6 metrics, at all levels | Ideal for optimization & competitor tracking |
| Shopping | No | Medium detail: no keywords, product-based insights | Focus on feed quality, pricing, and visuals |
| Performance Max | No | Minimal: no competitor data, no keywords | Use for scale, but don’t rely on it for insights |
How to filter and segment Auction Insights to find what really matters
Auction Insights gives you the “what,” but it’s the way you slice it that reveals the “why.”
Looking at the default report is fine but it’s like reading the average of your week. You won’t see the details that actually move your performance. If you want to make smarter decisions about bids, budgets, or targeting, you need to break the report down.
Here’s how to do that in a way that helps you make real, actionable choices.
Start with date ranges
Most founders check Auction Insights using whatever default date range is loaded like usually 30 days. But that can hide what’s actually happening right now.
Try narrowing it down to this week vs last week, or even compare the last 7 days with the 7 days before that. If your impression share suddenly drops, or a new competitor starts appearing, this is where you’ll catch it.
You’ll also start noticing patterns. Maybe a competitor only becomes aggressive during product launches or sales periods. If you're not zooming in, you’ll miss those timing windows and keep wondering why your CPC suddenly spiked.
Break it down by device
Mobile vs desktop can make a huge difference, both in user behavior and in competition. And yet, most founders don’t think to check whether they’re getting outranked more often on mobile than on desktop.
Segmenting by device tells you that. It might reveal that your competitor is dominating on mobile while you’re holding your ground on desktop, which is a sign that:
- Your mobile experience might be slow or clunky
- Your mobile ads don’t read well
- Or your mobile bids are too conservative
Once you know this, you can act. Tighten up your mobile landing page, test shorter headlines, and increase mobile bid adjustments if it’s worth winning back that audience.
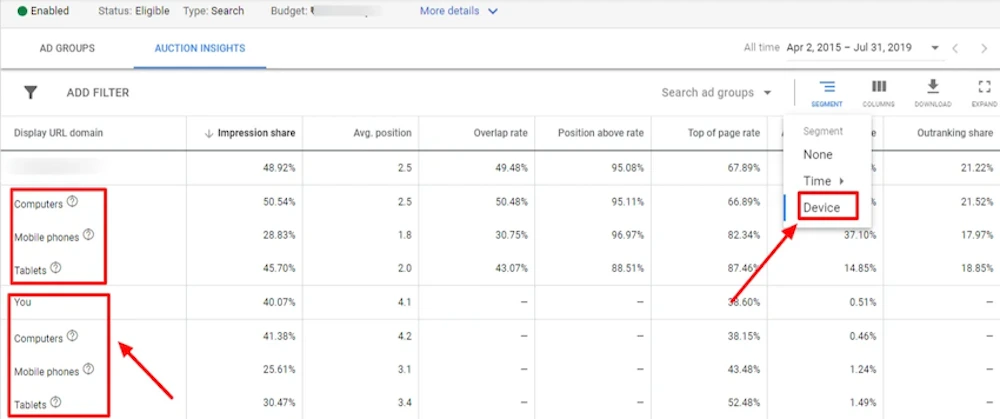
You can filter by device on Auction Insights. Source: Karooya
Look at day of week and hour of day
Google’s ad auctions don’t treat all hours equally. Your ads might be performing great in the mornings, but bleeding money in the afternoons when stronger competitors ramp up. Or maybe weekends are way more competitive and your budget’s getting chewed through for fewer conversions.
Segmenting by day and hour shows you when you're getting outranked or losing impression share. That lets you adjust your ad schedule to run during your strongest windows and avoid burning money in weak ones.
If, for example, your outranking share plummets on Fridays, maybe you scale back Friday spend and reinvest on Tuesday mornings — where you’re consistently winning.
This also helps if you’re a solo founder running ads globally because sometimes, you might be getting outranked while you’re asleep!
Zoom in on specific campaigns or ad groups
Auction pressure isn’t equal across your account. Some campaigns will face tougher competition than others, and Auction Insights can help you zoom in on where the real fights are happening.
Maybe your brand campaign has a low outranking share, which means that competitors are bidding on your brand terms. That’s worth defending. Or your high-intent “Demo Now” campaign might be getting less visibility in search results, even though it’s your best performer, simply because competitors are bidding more aggressively or have higher ad relevance.
Segmenting at the campaign or ad group level gives you clarity on where to spend your time, budget, and energy. It helps you avoid applying a fix across everything. Instead focus on the areas that are under attack.
A few patterns to watch for as you explore:
- Competitor shows up only during weekends? They’re probably testing against weekend shoppers or leisure buyers. You can sidestep or lean in.
- Top-of-page rate drops after 4 p.m.? Your competitors might be increasing bids late in the day. If evenings don’t convert well for you, consider dropping out of the race at that time.
- Impression share steady, but outranking share slipping? You’re still visible, but lower than before. Time to sharpen your copy or revisit Quality Score.
How to apply Auction Insights to improve ad performance
So now you know what the metrics mean, and you’ve broken them down by time, device, and campaign. The next step is using those insights to actually improve how your ads perform in terms of more clicks, lower cost-per-acquisition, and higher visibility.
Below are common scenarios you’ll likely run into, and exactly what to do in each case.
You're showing up too little (low impression share)
If your impression share is under 50%, you’re only reaching half the potential customers who are searching for what you offer. That’s a big gap.
This usually means:
- Your budget is running out before the day ends
- Your ad rank is too low (because of low bids, poor ad relevance, or both)
What to do:
- First, check if your campaign is hitting its daily budget cap. If so, consider increasing it slightly, especially if your conversion rate is strong.
- If budget isn’t the issue, improve your Quality Score: write more relevant headlines, tighten keyword-to-ad group alignment, and ensure your landing page matches the promise in the ad.
A competitor keeps outranking you
If one name keeps showing up above yours, especially with a high Position Above Rate or a better Top of Page Rate, you’re losing prime ad real estate.
That doesn’t always mean they’re bidding more. Often, they’re just getting rewarded for higher relevance or better engagement.
What to do:
- Search your main keywords manually and look at their ads. Is their messaging clearer? Do they use sitelinks or callouts you don’t?
- Refresh your copy to better match search intent. Stronger offers, clearer CTAs, or even emotional hooks (like urgency or credibility) can close the gap.
- If that doesn’t help, test a modest bid increase. This is especially relevant for high-value keywords and monitor whether your top-of-page rate improves.
You’re winning on desktop but losing on mobile
Segment by device. If you’re doing fine on desktop but your mobile impression share or outranking share is tanking, that’s a sign your mobile experience is hurting your rank.
What to do:
- Check how fast your mobile landing page loads. Anything over 3 seconds? Fix that first.
- Make sure your headlines are easy to scan on a small screen. Shorter is better.
- Increase your mobile bid adjustment slightly. Sometimes even a +10% can help if your margins allow it.
You're winning impressions, but no conversions
This happens when your Impression Share is high, but performance (leads, signups, purchases) is flat.
It means you’re being seen, but not clicked, or not converting once people land.
What to do:
- First, look at CTR (click-through rate). If it’s low, your ad copy isn’t resonating, try clearer benefit statements or urgency.
- If CTR is solid but conversions are weak, the issue is likely your landing page. Review the offer, form layout, or even page speed.
- You can also use Auction Insights to spot whether someone new entered the space and is stealing your intent with a better hook.
A new competitor appears in your report
Keep an eye out for sudden new names in the Auction Insights list, particularly with high overlap rate or impression share.
This could mean someone just launched a campaign targeting the same audience, and they’re now fighting for your space.
What to do:
- Search your core keywords and see how they’re positioning themselves.
- If they’re attacking your brand name or undercutting your offer, respond quickly. Do this wither with stronger positioning or a dedicated branded campaign to protect your turf.
You’re dominating a keyword, but it’s not converting
If you have high absolute top of page rate and outranking share, but the keyword doesn’t bring in results, that’s a red flag.
You’re paying to be first, but for what?
What to do:
- Reevaluate the keyword’s intent. Are people searching to buy or just learn?
- Consider moving that keyword to a separate campaign with tighter bidding, or pausing it altogether if it’s burning budget.
- Reallocate spend to better-performing terms where you can afford to defend top spots.
Auction Insights is a goldmine if you know what to look for and how to react. It tells you where you're strong, where you're leaking budget, and where you need to sharpen your edge.
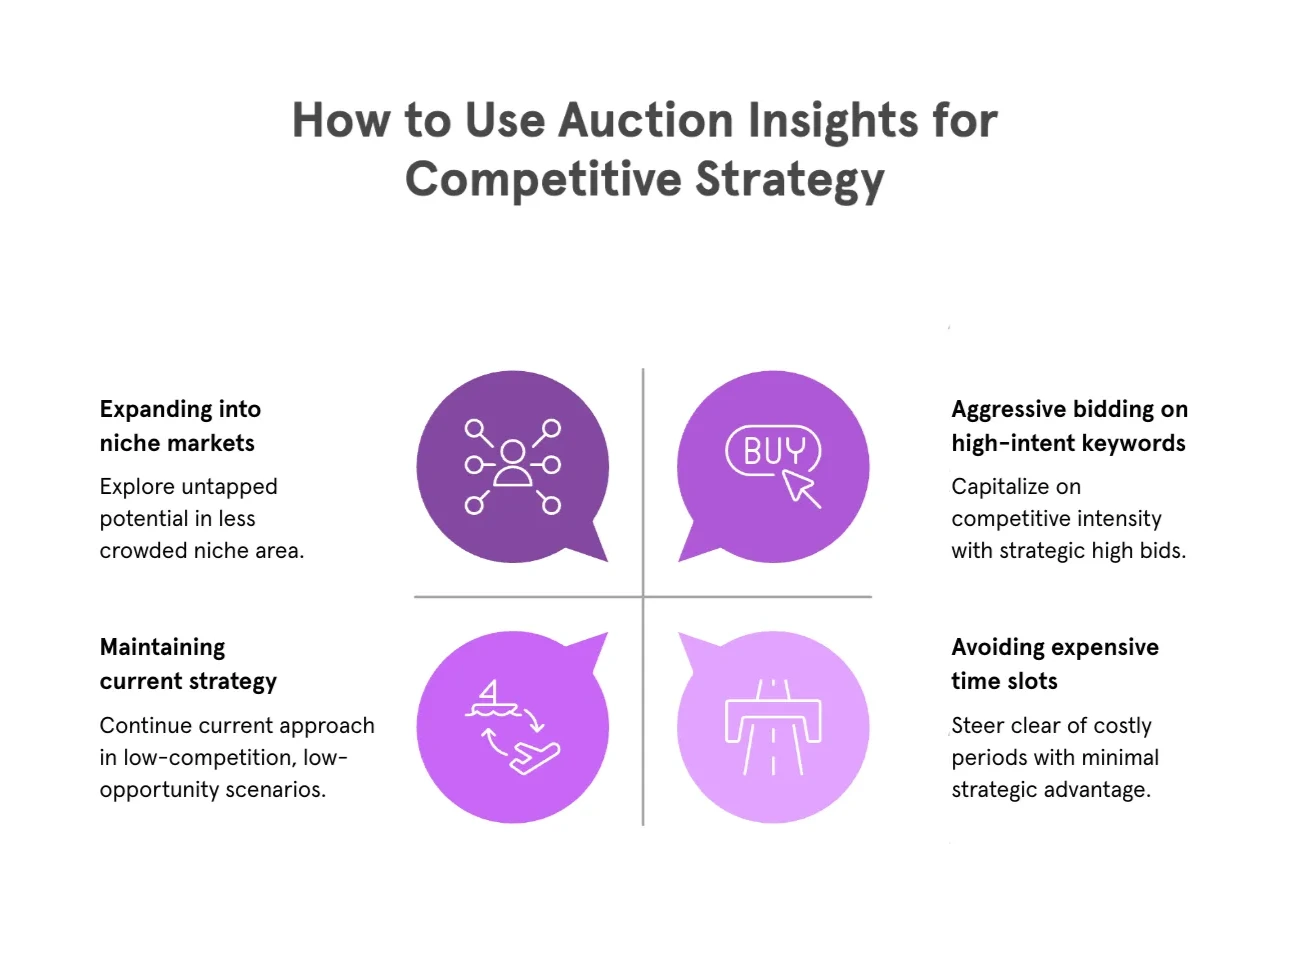
How to use Auction Insights for competitive strategy
Here’s how to use Auction Insights not just reactively, but proactively — to beat competitors before they even know what hit them.
1. Identify who your real competitors are
Many founders think they know who their competitors are: the big players in their industry, or that brand they keep seeing on Instagram. But Google’s auction data often reveals surprises.
You might be showing up next to:
- Niche players you’ve never heard of
- Aggregator sites like G2, Capterra, or marketplaces
- Resellers or partners you didn’t expect to compete with
- Brands from a different vertical bidding broadly
Instead of guessing, Auction Insights tells you who’s actually bidding on the same searches your customers are making.
Here’s what we recommend:
- Open Auction Insights at the keyword or campaign level for your core converting terms
- Make a list of the top 3–5 domains that keep showing up
- Google your target keywords and manually review what their ads say. This gives you immediate clues about how they’re positioning themselves
2. Understand your competitor’s bidding strategy
You can’t see their bids, but you can infer their strategy from how they appear in the auction.
Look at their:
- Impression share: Are they scaling aggressively?
- Overlap rate: Are they bidding on broad keywords or tightly focused terms?
- Top of page rate vs outranking share: Are they pushing for visibility, or just sniping cost-efficient slots?
Here are some real-life scenarios and what they imply:
| Scenario | Pattern | What it suggests |
|---|---|---|
| Low top of page rate | High impression share but low top of page rate | Competitor is likely running budget-efficient, low-bid campaigns |
| Weekday-only activity | High outranking share but only during weekdays | They’re probably dayparting — scaling bids during business hours |
| Narrow intent focus | Low impression share but high position above rate | They’re selectively bidding high on a narrow slice of high-intent keywords |
Here’s what we recommend: Use these patterns to decide whether you want to go head-to-head, avoid expensive time slots, or outflank them with better ad copy or landing pages.
3. Watch for budget surges (and fight smarter)
If a competitor suddenly jumps in impression share or starts consistently outranking you, they’ve likely increased their budget or launched a promo.
Instead of trying to outspend them, ask:
- Can you shift spend to another time window or device where they’re less aggressive?
- Can you counter-position your product with stronger value props (e.g. “Better than [Brand X]” comparisons, free trials, limited-time offers)?
Here’s what we recommend:
- Look at your Auction Insights report week over week
- Highlight any competitor with a sudden change in impression share or outranking
- Use this as a trigger to adjust, either by shifting your spend or pushing better offers
4. Defend your brand terms (or bid on theirs)
If you’re running a branded campaign, such as bidding on your company name, keep a close eye on Auction Insights. If a competitor is showing up there, they’re trying to steal your intent traffic.
On the flip side, if a competitor isn’t protecting their own brand terms, it might be worth testing conquesting campaigns i.e. bidding on their name.
Here’s what we recommend:
- Check Auction Insights for your branded keywords weekly
- If you see any competitor with high overlap or outranking share, improve your brand ad copy to reinforce trust and click intent
- If their brand isn’t showing up at all? Run a test campaign targeting their name + pain points (“[Brand X] too complex? Try [YourProduct]”)
By the way, conquesting can be aggressive. So use it carefully, and be prepared to pull back if costs spike or if it feels off-brand.
5. Spot quiet wins (and double down)
Sometimes you’ll notice a keyword or campaign where your outranking share is high, your top of page rate is strong, and competition is light.
That’s a signal you’ve found a pocket of opportunity.
Here’s what we recommend:
- Isolate that ad group or keyword
- Increase budget slightly to capture more volume
- Test doubling down with ad extensions, better landing pages, or even pushing that term in your SEO strategy. Why? Because it’s clearly converting and under-competitive
What Auction Insights can’t tell you (and what to watch out for)
Auction Insights is one of the most useful tools inside Google Ads — but it’s not perfect. It gives you a peek into the competitive landscape, but that peek is limited, and if you don’t know its blind spots, you’ll either overreact or miss what really matters.
Below are the core limitations to keep in mind and how to work around them so you’re making smart, balanced decisions.
It doesn’t show conversion data
Auction Insights tells you who you’re competing with and how often you appear. It shows rankings, visibility, and how your ad placement compares to others. But it tells you nothing about what happens after someone sees that ad. There’s no visibility into click-through rates, conversion rates, or how profitable any of those impressions were.
This creates a trap: you might see another brand outranking you and assume you need to increase your bids, when in reality, they could be spending inefficiently, while your lower-ranked ad quietly delivers a better return. That’s why it’s important to focus on efficiency, not ego — you're building a business, not running a popularity contest. Let competitors overpay while you quietly convert profitably.
What to do instead:
Bring Auction Insights and your campaign performance reports side by side. If your impression share is lower, but you’re still hitting your Cost-per-Acquisition (CPA) targets or Return-on-Ad-Spend (ROAS) goals, that’s a sign you don’t need to fight for the top. Rather, you’re already winning on the bottom line.
You should also look at your CTR and Quality Score to make sure you’re not being penalized for irrelevance. But don’t chase visibility for the sake of it.
It doesn’t work for all campaign types
Auction Insights gives the best results with Search campaigns, some visibility with Shopping, and barely anything with Performance Max or Display. By design, Google wants more automation in PMax, so it hides most auction-level data.
If you’re only running Performance Max, Auction Insights won’t tell you who you’re competing with, where you’re showing up, or how you rank. This makes it hard to make tactical decisions. That’s why it’s smart to treat your manual Search campaign as a control panel — even if Google is doing the heavy lifting, you still need a clear window into how your brand is showing up and what’s actually happening in the market.
What to do instead:
Run at least one manual Search campaign, even if small. Use it to cover:
- Branded search terms (your company or product name)
- High-intent keywords tied directly to conversions
This gives you access to real Auction Insights like competitor names, outranking share, and positioning that PMax simply won’t reveal. You can still scale with Performance Max, but your Search campaign becomes your visibility checkpoint.
It doesn’t show exact bids or ad copy
Auction Insights shows you if someone is outranking you, but it doesn’t tell you how they’re doing it. You won’t see what they’re bidding, what kind of ad extensions they use, or whether their landing page is converting better than yours.
You might be tempted to respond with higher bids but without understanding their strategy, you’re just throwing money at the problem. Instead of making assumptions, get context: if you’re going to compete, compete smarter by seeing exactly what your customers see.
What to do instead:
Manually search your core keywords in incognito mode (so results aren’t skewed by your browsing history). Look at the actual ads showing up above yours. Are they using stronger headlines? Better offers? Multiple extensions?
If you want deeper data, use free tools like Google’s Ad Preview Tool, or try platforms like SpyFu, Semrush, or iSpionage. Even their free versions will often show sample ad copy and landing pages competitors are using.
It doesn’t refresh in real time
There’s often a 24 to 48-hour delay in Auction Insights data. If you launched a new campaign, increased your bids, or changed your targeting yesterday, that change won’t appear right away. This delay also means it’s not great for tracking sudden shifts or daily optimization.
Plus, if your campaign doesn’t generate a lot of impressions or clicks, Google may not show you auction data at all or only partial results. Think long-game here: patterns matter more than one-day shifts.
What to do instead:
Check Auction Insights on a weekly basis — ideally the same day and time each week. That way, you’re comparing apples to apples and spotting meaningful trends over time.
Create a simple Google Doc or Notion page where you track key Auction Insights metrics week over week. This gives you context before you act.
It doesn’t explain why things changed
You might notice a competitor suddenly outranking you. But Auction Insights won’t tell you why. It doesn’t say if they raised their bids, if your Quality Score dropped, or if demand increased due to seasonality or external trends.
This makes Auction Insights more like a mirror — it reflects the current picture, but it doesn’t explain how you got there. That’s why you need to pair it with performance data to uncover the “why”. When you see the whole picture, you can make decisions with confidence.
What to do instead:
Use other reports to investigate. Start with:
- The Search Terms Report to see if your ads are matching to less relevant queries
- The Quality Score breakdown to see if your ad relevance or landing page experience has dropped
- The Change History in your campaign to confirm if you or Google adjusted anything recently (like bid strategies or budgets)
Layering these tools helps you build a cause-and-effect timeline. You’ll know whether it’s time to fix your side or just wait out a competitor’s short-term push.
Pro tips to make Auction Insights part of your weekly routine
You don’t need to check Auction Insights every day. You don’t need to obsess over every shift in impression share. But if you check it consistently and intentionally, Auction Insights can become one of the most powerful tools in your ad strategy — not just for optimization, but for staying ahead of the competition.
Here’s how to build it into your workflow in a way that’s sustainable and useful.
Pick one time each week to check
Choose a consistent day. Say, every Tuesday morning or Friday afternoon and spend just 20–30 minutes reviewing Auction Insights. Look for:
- Any major drops in impression share or outranking share
- New competitor domains that showed up this week
- Shifts in top of page rate that might indicate bidding pressure
By reviewing week over week, you’ll start spotting trends and avoiding knee-jerk decisions based on daily noise.
Use consistency to catch early signals. Most startups react too late. So, you can catch changes early by just checking once a week.
Create a simple tracking document
Keep a running log (in Notion, Google Sheets, or even a physical notebook) where you jot down key insights each week:
- Top 3 competitors in each core campaign
- Changes in overlap or outranking share
- Any noticeable shifts in device performance or dayparting trends
Over time, you’ll build a mini timeline of auction dynamics and that’s priceless for planning your next campaign push, product launch, or budget shift.
You don’t need full-blown dashboards. A simple log will show you who’s entering, leaving, or scaling in your space.
Use filters for deeper insights, but only when needed
You don’t have to segment by device, day, and hour every time. But if you notice something off e.g., lower conversions this week or higher CPC, you should go deeper by:
- Segmenting by device to see if mobile’s lagging behind
- Filtering by day of week to spot if a competitor is weekend-only
- Comparing this week vs last week when performance suddenly dips
Don’t over-segment by default. Use it only when something looks off. Build a simple default view, then zoom in with intent. The goal is clarity, not complexity.
Set alerts for performance, not auctions
Google Ads doesn’t let you set alerts for Auction Insights but you can set alerts for spend, CPA, conversion drops, or CTR.
Use those alerts as a trigger: when something spikes or dips, that’s your signal to check Auction Insights and see if competition played a role. Let your KPIs tell you when to investigate.
Share findings (even if you’re solo)
If you're working with a freelance marketer or agency, bring Auction Insights to your check-ins. Ask:
- “Why are we being outranked more often now?”
- “Which competitors are consistently showing up above us?”
- “Should we defend our brand terms more aggressively this month?”
If you're running things solo, just speaking your insights out loud (or writing them down) can help you think more clearly and spot patterns faster.
Use insights to lead, not just to react. Even a single line of data can shape a stronger strategy when you treat it like a signal, not just a report.
And that’s it. You now know exactly how to use Auction Insights like a pro. From understanding what the metrics actually mean, to spotting strategic shifts, filtering the data for better decisions, and using it to punch above your weight this tool is now yours to leverage.
FAQ
What are Auction Insights in Google Ads?
How do I access Auction Insights in Google Ads?
What is the difference between impression share and outranking share?
How can I use Auction Insights to improve my Google Ads performance?
Does Auction Insights work with Performance Max campaigns?
Final thoughts
If you’ve made it this far, you now know more about Google Ads Auction Insights than 90% of founders (and advertisers).
You know what the report actually tells you, how to read the metrics, how to filter and segment the data to spot real trends, and how to turn those insights into actions that improve your performance without wasting budget or guessing what’s working.
For a solo founder or small team, this is one of the most powerful tools in your Google Ads dashboard. Use it regularly, keep a pulse on your competition, and you’ll be in a far stronger position to make smart, confident decisions without relying on gut feel or agency dashboards.
That said, everything we’ve covered here is still just the foundational playbook. There are more advanced ways to use Auction Insights:
- Layering it with cross-account competitive trends
- Mapping overlap rates against multi-channel campaign timing
- Interpreting changes in auction behavior based on industry-specific benchmarks
- Using scripts or dashboards to proactively monitor competitor movements
These are the kinds of insights that come from years of experience running campaigns across industries and that’s where a skilled agency can make a real difference.
If you ever feel like you’re doing all the right things, but not seeing the right results, or if you simply want to shortcut the learning curve and get straight to what works working with an agency can give you that unfair advantage. You’ll still own the vision, but with a team that knows exactly how to turn Auction Insights into profitable decisions, week in and week out. Here are 8 more signs that your startup needs a Google Ads agency.
Because data is only as good as what you do with it and the right partner knows what to do.